
Among many value investors there is a consensus that if you are going to make a bargain, you need to find the cheapest stocks out there, with the lowest PE etc.
But this is not exclusively the case.
For decades, British investor Terry Smith has crushed the average return on the stock market, and he does so by investing in what most people see as expensive, unexciting stocks.
One of his biggest positions is Novo Nordisk - a large Danish pharmaceutical company that is perhaps best known for its diabetes treatment.
Let's see why he has so much faith in this big, solid company in this article. Here we will go through which factors Smith uses when he analyses, and how he values stocks to find out whether the stock is a good buy or not.
- Who is Terry Smith?
- 1. Buy good companies
- Terry Smith's 6 key figures
- Analysis of Novo Nordisk
- 1. Gross Margin
- 2. Operating Margin
- 3. ROCE
- 4. Cash conversion
- 5. Debt to equity ratio
- 6. Interest cover
- 2. Don't overpay
- 3. Do nothing
- A few final words about Novo Nordisk
- Want a quick way to identify a quality company?
Who is Terry Smith?

Terry Smith is often called 'Britain's Warren Buffett', and is a successful fund manager who has invested for over three decades.
He set up the investment fund Fundsmith in 2010, and since then has had an average return of 15 per cent annually – which has made it the largest fund in United Kingdom.
In comparison, the global index fund MSCI World Index has had an average return of 11 per cent in the same period.
But unlike Buffett, Smith is more outspoken. In his book Accounting for Growth he criticized the accounting practices of companies after many high-profile companies went bankrupt in 1990. This got him fired from UBS - his employer at the time.

Invest like the pros with FinChat.io
For you who are serious about stock analysis. Get access to all important key figures in a company's accounts and KPIs. You get a 30% discount via me.
Macro trends are difficult to predict, Smith believes, and joins the ranks of investors who exclusively do a 'bottom up' analysis of companies.
He believes that predictable and realistic growth opportunities are much more important to focus on. Smith looks for companies that deliver on a set of key metrics, and that have a competitive advantage.
Smith is known for his value-oriented investment philosophy and invests according to the following principles: ¨
- Buy good companies
- Don't overpay
- Do nothing
I also recommend his latest book Investing for Growth , where all Smith's articles written in the period 2010-2020 are collected.
In this article, we will methodically go through each point.
This article is quite extensive, so if you are just starting to invest, I would start with one of my other articles: stocks for beginners: a big guide to investing in stocks and mutual funds
1. Buy good companies
This point contains 6 key factors Terry Smith uses when analyzing companies, which we will look at further down.
The companies he invests in are predictable, have a competitive advantage, and have strong financial health with plenty of cash on the books.
In other words – these are companies he wants to own as long as possible.
Novo Nordisk, his second largest position as I write this article, is obviously one of those companies.
Furthermore, we use Novo Nordisk as an example, and you will see which factors Terry Smith uses in his analyzes of companies, and how you can use these yourself in your own investment.
You can easily find most of the figures in the accounts. I also give you the formulas in those cases where you have to calculate the key figures yourself.
Terry Smith's 6 key figures
Terry Smith uses the following 6 key figures when analyzing stocks:
1. Gross margin
This key figure measures the percentage of the company's revenue after deducting the cost of goods sold (COGS). This therefore tells us how efficiently the company uses materials, equipment and the workforce in production.
Companies with a high gross profit margin keep a greater proportion of their income than companies that are not as efficient here.
PS: Look for companies that have delivered consistently high numbers here over several years, not just the last year.
2. Operating margin
The operating margin measures the percentage of operating income that remains as profit. The higher the margin, the more profitable the company.
Operating margin can often vary in different industries and is affected by several factors, such as competition and pricing.
Since the operating margin gives us an indication of why a company is profitable, it often gives us insight into the company's competitive advantage in its respective industry.
3. Return on capital employed (ROCE)
Return on capital employed (invested) is a profitability ratio that is a very good way of assessing the company's ability to generate profit on its capital.
Other indicators such as return on equity (ROE) only look at the profitability in relation to the company's equity, while ROCE focuses on all available capital to generate profit - i.e. investments financed by both equity and debt.
A higher ROCE than is usual in the sector indicates that the company has been able to create a higher percentage return on capital employed than what is expected.
I myself like to look at both ROE, ROA and ROCE when evaluating companies. I prefer to invest in companies if they deliver stable returns of over 25 percent annually.
4. Cash conversion ratio
How much of the company's income remains as cash? The cash conversion ratio measures how efficiently a company converts its profits into actual cash that the company can use further.
We ideally look for a ratio close to 1 (100%) or slightly above.
If the cash flow conversion ratio is much lower than 1, it may indicate a potential liquidity problem as the company is unable to convert enough of the profit into cash.
If, on the other hand, they have a number much higher than 1, this may mean that the company has a lot of liquidity, perhaps because customers pay in advance or that expenses are deferred.
This may indicate that the company should invest this money to grow further.
How to calculate the Cash Conversion Ratio
Free Cash Flow/Net Income x 100 = Cash conversion ratio
Most often, Cash from operations is used instead of FCF in the calculation of cash conversion, but Terry Smith uses the formula you see in the info box above.
Smith emphasizes that good cash conversion must be linked to a steady and nice increase in net income year on year as well.
Invest like the pros with FinChat.io
For you who are serious about stock analysis. Get access to all important key figures in a company's accounts and KPIs. You get a 30% discount via me.
5. Debt-to-equity ratio
How much debt does the company have in relation to equity?
Companies with a lot of debt in relation to equity are often seen as more risky for investors to invest in, as this can lead to problems with liquidity should bad times come.
Smith therefore recommends that investors minimize investments in companies with a high debt-to-equity ratio.
What is a high ratio, you ask?
It is generally widely agreed that companies with a debt-to-equity ratio of 50% or less are good choices, while companies approaching 100% or more are more vulnerable, and may therefore be riskier investments.
6. Interest cover
The interest coverage ratio measures the company's ability to cover existing interest payments on loans.
This ratio is calculated by dividing the company's EBIT by the interest cost.
Terry Smith advises investors to stay away from companies with an interest coverage ratio below 10.
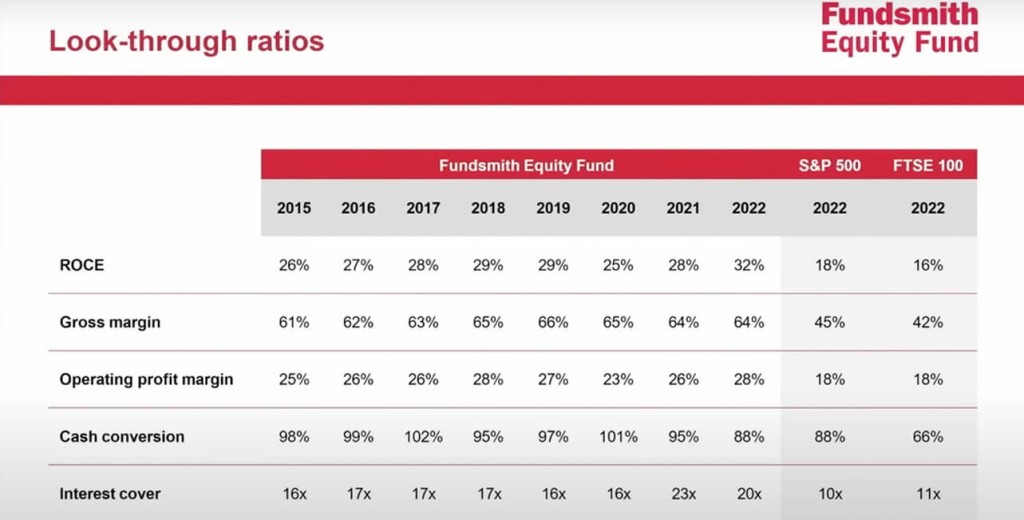
Above you see Fundsmith's 'look-through ratios' compared to the S&P 500 and FTSE 100. Note in particular that Fundsmith scores considerably higher on ROCE.
Analysis of Novo Nordisk
Before we begin the analysis of Novo Nordisk: how to find all these key figures mentioned above as quickly and easily as possible?
I use two platforms when I analyze companies, which you can see a quick overview of below. You can create a free user with both, but the paid versions have more features that I recommend. I have secured an exclusive agreement with both - and thus very good discounts for you who read this blog.
Especially FinChat is valuable if you want to do a detailed analysis similar to what we do in this article. However, Simply Wall St is very good for those who want a quick, visual analysis and valuation of individual shares as well.

I recommend Finchat.io to you who are serious about investing in individual shares, who want detailed information on companies' key figures. You also get access to an AI chat dedicated to finance. Even professional investors use FinChat, and if you're a graph lover, this is for you.
Simply Wall St is for you who want to be served a simple overview of a company, in addition to getting their 'intrinsic value' via the cash flow method. It gives you a clue as to whether you are buying an underpriced or overpriced share - in a simple visual way.
Have you created a user yet?
Then we can continue, and start analyzing Novo Nordisk with Terry Smith's principles.
1. Gross Margin
Gross profit margin is, as mentioned, the difference between earnings and the production cost (Cost of goods sold).
How is Novo Nordisk doing on this front?
In the picture below, we can easily see that Novo Nordisk has an average gross profit margin of over 80%. It's insanely good!

The first point is therefore approved. Let's jump to the next criterion, which is the operating margin.
2. Operating Margin
Novo Nordisk has a fantastic operating margin, and delivers over 40 per cent as you can see in the picture below. This means that the Danish company has a strong main business that generates a lot of profit.

But how effectively do they generate returns on invested capital? We will find out in the next point.
3. ROCE
Novo Nordisk is very good at creating a return on capital employed!
Just have a look:

With a ROCE of over 60 per cent, it means that Novo Nordisk has a very efficient use of its capital, which is to the shareholders' advantage.
4. Cash conversion
Novo Nordisk has a cash conversion of 1.2.
This number therefore says something about what proportion of the profit that can be converted into money Novo Nordisk can use for example to:
- Pay dividends to shareholders
- Reinvest in itself
- Buy other companies
- Pay off debt
- Stock buybacks

As you can see in the picture above, I have equated net income with free cash flow. What I like about FinChat is the visual graphs, which makes it much easier to see the numbers before you do the math.
When I calculate cash conversion by dividing free cash flow by net income, I see that Novo Nordisk has a cash conversion of 1.2 (120%), which is certainly approved according to Smith's criteria.
An extra bonus point is given for the fine, steady rise in both net income and free cash flow over the past few years.
5. Debt to equity ratio
Novo Nordisk has a debt to equity ratio of around 30 per cent. This is an increase from recent years, but still well below 50 per cent, or 100 for that matter.
In other words: definitely approved.

6. Interest cover
As mentioned, the interest coverage ratio measures Novo Nordisk's ability to cover existing interest payments on loans.
Remember I wrote above that Smith recommends staying away from companies with an interest cover of 10?
Well, then you are safe with Novo Nordisk, which has an interest cover of over 200!

2. Don't overpay
Furthermore, it is important to buy the company at the right time. That is, when the company is underpriced.
Is Novo Nordisk overpriced, underpriced or priced correctly in today's market?
There are many ways to calculate out a company's value on, but Smith prefers to use the Free Cash Flow Yield method.
Terry Smith likes to buy a stock when the free cash flow yield is 5 percent or more.
Next, let's see why he uses this and how the Free Cash Flow Yield is calculated:
Free Cash Flow Yield for stock valuation
Free Cash Flow Yield measures how much cash is generated from core operations relative to valuation.
For example: A Free cash flow yield of 5 percent means that the company generates 5 percent of its market value in free cash flow annually.
Formula: Free cash flow yield
Free Cash Flow per share/share price = Free cash flow yield
Novo Nordisk has (February 5, 2023) has:
- Novo Nordisk Share price: 941,50
- Novo Nordisk Free cash flow per share: 28.31
(Both figures taken from FinChat.io)
Calculation
28,31/941,50 = 0,03
FCF yield = 3 %
Novo Nordisk has a free cash flow yield of around 3 per cent today.
It is lower than Terry Smith's demand of 5 percent, which means that it may pay to sit still and wait for a better opportunity to get hold of this quality company.
Invest like the pros with FinChat.io
For you who are serious about stock analysis. Get access to all important key figures in a company's accounts and KPIs. You get a 30% discount via me.
3. Do nothing
We do nothing quite well.
-Terry Smith
Once you have bought the stock, you now know, based on the key factors we have covered in this article, that you have bought a very good quality company.
The most important thing you can do then is not to do anything in the world, other than to wait - either for the recovery, or for an opportunity to accumulate more shares in the event of a possible decline in the share price.
Of course, it is important to keep a close eye on the key figures going forward as well. Should, for example, the return on invested capital plummet, it is important to find out hvorfor, og om dette gir grunn til å selge aksjen i stedet.
You can read more about when to sell a stock in this article.
A few final words about Novo Nordisk
As you can see, Novo Nordisk meets all of Terry Smith's criteria with the exception of valuation.
However, he bought the stock quite some time ago, and there is reason to assume that he had a cash flow yield that matched his requirements.
Want a quick way to identify a quality company?
Then you should download my checklist!
See which 7 steps you should go through before investing in a share, which increase the probability that you have made a well-thought-out choice.
Click on the image below to download the list. Use it immediately and become a better investor in just a few seconds.

