
Bottom line and top line are two of the most important lines you have to look at in a company's income statement when analyzing a company.
Analysts and investors alike watch these two lines closely to watch for quarter-to-quarter and year-to-year changes.
The Top line tells you what the company has had in total earnings before taxes and expenses. When we say that a company has top-line growth, it means that they simply have an increase in how high their revenue is before we deduct expenses and costs.
The 'bottom line' is in turn the 'naked truth'. Here we see what the company is left with after expenses have been deducted from the total revenue. These are expenses such as debt repayment, administrative costs, tax, marketing costs, and so on.
The bottom line can be called ‘net income’, ‘net profit’, eller ‘net earnings' in the income sheet.

Invest like the pros with FinChat.io
For you who are serious about stock analysis. Get access to all important key figures in a company's accounts and KPIs. You get a 30% discount via me.
Key points:
- You can use both top line and bottom line to determine how the company is performing, and how they are positioned financially in your stock analysis.
- The bottom line tells you a lot about how efficiently a company uses its revenue in terms of expenses and other costs. If they are good, they are left with profits which can then be reinvested in themselves, make acquisitions, buy back shares, be paid out as dividends or pay off debt.
- The top line, in turn, tells you how efficiently the company generates income and does not take into account expense items that can have a dramatic effect on how much the company is actually left with on the bottom line.
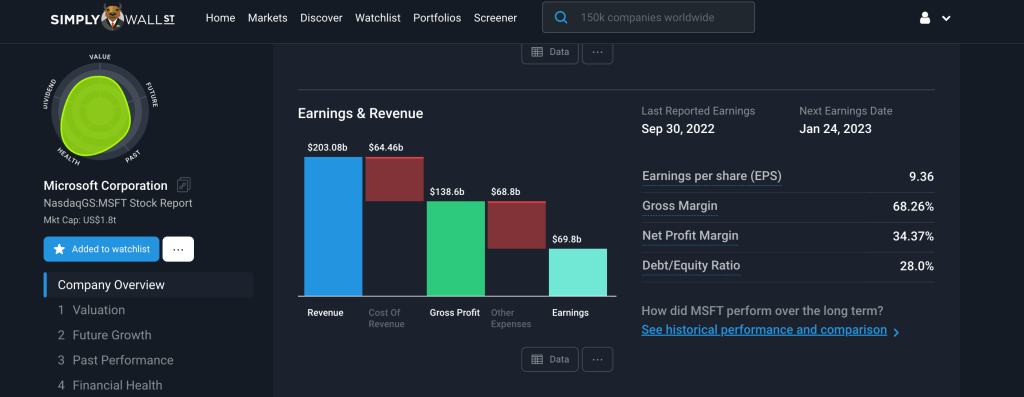
In the image above, you can easily and visually see how much Microsoft is left with (earnings – bottom line) after the costs have been deducted from the revenue (top line). See the full analysis of Microsoft on Simply Wall St here and create a free user.
How to improve the bottom line
Management can strategize to increase the bottom line. This can be done, for example, by:
- Increase total earnings (ie the top line). This can be done by, for example, increasing production, improving products, increasing prices and streamlining operations.
- They can also sell assets,such as real estate and machinery to raise more money which can increase the bottom line (This is not included in the top line as it is not income from main operations).
- Cut costs and expenses. Here it is about saving on costs, for example by dismissing parts of the workforce, reducing wages and other benefits, finding new and cheaper suppliers/collaborators, optimizing tax deductions, and so on.
As I have already touched on, management can choose to use the bottom line in several ways. The bottom line can be used, among other things, for financial measures such as reducing debt, paying dividends to shareholders, buying back shares and buying up other companies.
Or maybe the company chooses to spend it all on further developing the products, expanding the locations, or making other investments in itself that benefit the company's further growth.
How the bottom line is prioritised, tells you a lot about the type of company you may be about to invest in.
How companies improve the top line
A company that has an increase in the top line usually has an increase in sales and income. But there are several ways a company can increase its top line, such as:
- Specific marketing campaigns that for example increase the number of customers by 15% from the previous quarter
- New product
- Acquisition of another company, which increases the market value of the company
Although the top line shows you how efficiently the company is operating in terms of generating money in general, it does not take costs and expenses into account.
The word "top line" originates from where you find the total revenue in a financial statement, namely top. Bottom line - yes, you'll find it at the bottom of the financial statements.
Topline shows you a company's earnings in terms of its main operations. A company can make money in other ways too, for example interest income, or from the sale of assets.
Invest like the pros with FinChat.io
For you who are serious about stock analysis. Get access to all important key figures in a company's accounts and KPIs. You get a 30% discount via me.
As mentioned, the latter is a type of income that should not be included in the top line, as this has nothing to do with the company's main operations.
Key differences between bottom line and top line
The very best companies usually manage to increase both the top line and the bottom line, year after year. But more established companies can quickly see that turnover flattens out somewhat. Nevertheless, such companies are extremely good at increasing the bottom line, thanks to their ability to reduce costs.
I share 3 different strategies you can use for stock analysis in this article, if you are interested in reading more about stock valuation.
Knowing the difference between the top line and the bottom line is important for you as an investor, as you can identify how a company spends its money and thus make a more informed decision before investing or not.
Read also: shares for beginners: a great guide to investing in shares and fund
Two valuable tools for stock analysis

Via me, you get a number of good discounts on products that I myself actively use every single day.
Two tools I really recommend you check out are Simply Wall St and FinChat. You can read more about them in the boxes below.

I recommend Finchat.io to you who are serious about investing in individual shares, who want detailed information on companies' key figures. You also get access to an AI chat dedicated to finance. Even professional investors use FinChat, and if you're a graph lover, this is for you.
Simply Wall St is for you who want to be served a simple overview of a company, in addition to getting their 'intrinsic value' via the cash flow method. It gives you a clue as to whether you are buying an underpriced or overpriced share - in a simple visual way.
Here you will find both a simple overview of companies' accounts, company news and much more useful that makes stock analysis both faster and more fun than ever.
In other words, you will become a better investor, so create a user with both today!
